What Is a Cap Table? A Founder's Guide to Reading and Managing Equity
What a cap table is, how to read one, and what it looks like at each stage. Cap table examples from formation through Series A.
What Is a Cap Table? A Founder’s Guide to Reading and Managing Equity
The Short Version
A cap table (capitalization table) is the official record of who owns what in your company. It accounts for all shareholders, all share classes, and all option grants. It is the single source of truth for your company’s equity. If you’re raising money, hiring with equity, or planning an exit, the cap table is where the math lives.
Here’s what I wish more founders understood early: the cap table is not a document you create once and forget about. It is a living model that changes every time you issue stock, grant options, take investment, or promise equity to anyone. The founders who get into trouble are the ones who don’t update it until an investor asks to see it, and by then the errors have compounded into a mess that takes weeks and thousands of dollars to untangle.
The Cap Table Is a Forward-Looking Document
Although a cap table is a snapshot of current ownership, it is implicitly a forward-looking document. It reflects the division of incentives in the company for work to be done and value to be created. Most of that value should accrue to the leadership of the company and its employees, and it should accrue over time. That is why the option pool gets refreshed at every financing, and why investors will sometimes insist on rebalancing the cap table to make sure that the founders have sufficient incentive to do the hard work of building a startup.
This framing matters because many founders make the expensive mistake of awarding large equity shares to early advisors, academic contributors, or people who helped at the beginning but won’t be doing the ongoing work of building the company.
This is especially common in academic spin-outs. I recently worked with a medtech company where the principal investigator retained his university post, held 40% of the startup, but was not actively working for it. He had tenure, a steady paycheck, healthcare, and retirement benefits from the institution. The founders doing the actual work had insufficient equity to justify the risk, and investors saw a cap table with misaligned incentives. The company got no funding and the founders separated acrimoniously. This pattern kills more university spin-outs than bad technology does.
There is often an argument that a person who contributed initial IP should receive a large percentage of the company because they invented the core technology. But in most companies where technology IP is a key attribute of the business, the company continues to develop its portfolio over years. That initial IP, while it was the spark, may only represent a fraction of the intellectual property that is ultimately developed and used. Compensating someone for the spark as if they built the fire is a structural mistake that compounds over time.
Rules of thumb on equity allocation:
- No advisor who is not a full-time employee should hold more than 1% of the company. Carta’s 2025 data on 1,019 pre-seed advisor grants confirms this: the median advisor grant is 0.24%, and only about 1 in 10 advisors reach the 1% level. Standard terms are 0.25-1% vesting over 1-2 years with a cliff.
- No outside academic or IP contributor should hold more than 2% unless they are joining full-time. If they are truly that valuable, they should be an employee.
- Founder compensation should be primarily in equity, especially before Series A. Founders should be able to reduce their day-to-day financial stress after raising, but this is a long-term enterprise value maximization role, not a cash compensation role.
- If you’ve given away more than these amounts, or if the equity isn’t vesting, you have dead equity on your cap table that investors will question and that steals from the people who are doing the work.
What a Cap Table Tracks
At its core, a cap table answers one question: who owns what percentage of the company?
It tracks:
- Shareholders: Founders, investors, employees, advisors
- Share classes: Common stock, preferred stock, option pool
- Number of shares: How many each person or entity holds
- Ownership percentage: Each holder’s stake on a fully diluted basis
- Securities: Outstanding SAFEs, convertible notes, warrants
Early on, a cap table is simple. Each of the two founders has one share class and one row. After a few hires, an option pool, and a funding round, it gets complicated. By Series A, most companies have 15-30 line items across multiple share classes with different rights and preferences.
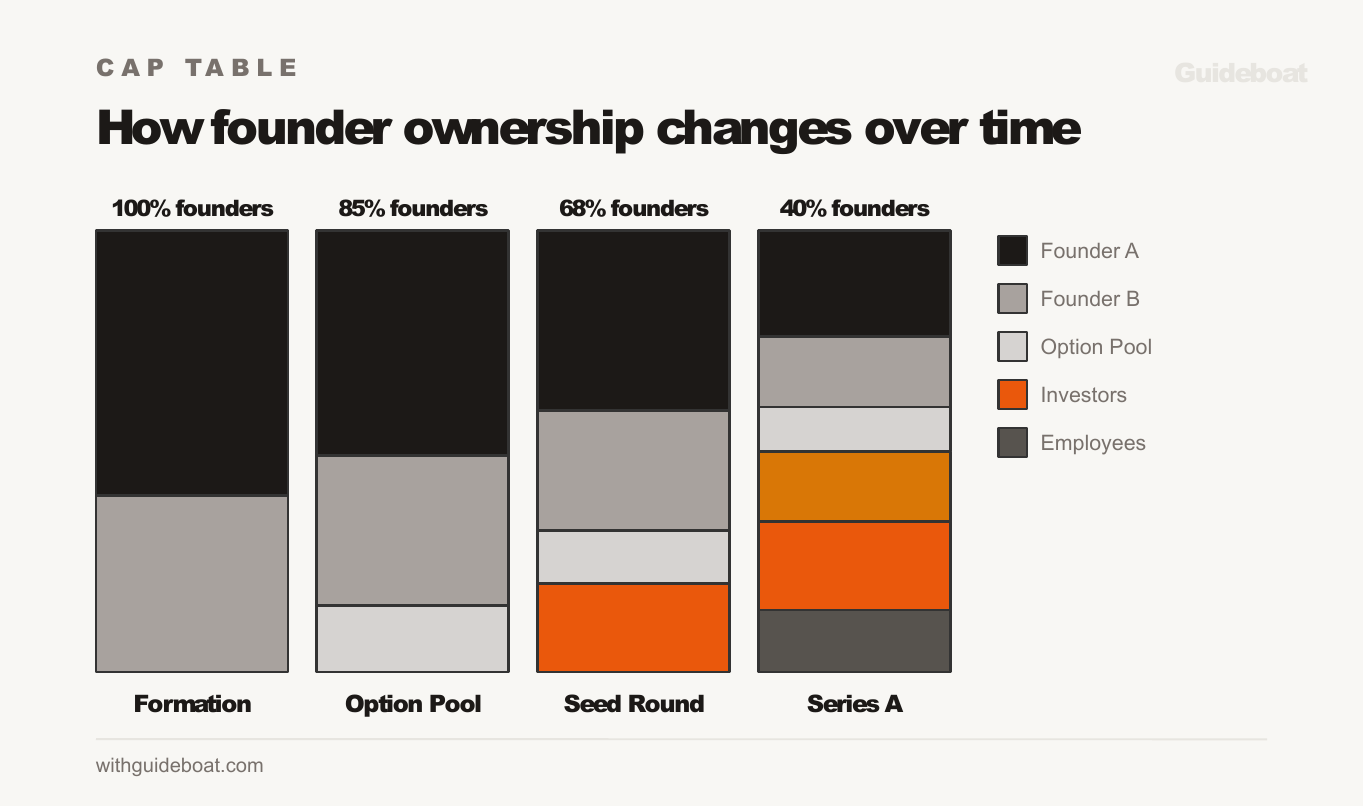
Cap Table Example: Formation to Seed
Here’s how a cap table develops through the first two years of a company’s life.
At formation
Two co-founders incorporate a Delaware C-Corp and authorize 10,000,000 shares of common stock. They split the equity 60/40.
| Shareholder | Share Class | Shares | Ownership |
|---|---|---|---|
| Founder A | Common | 6,000,000 | 60.0% |
| Founder B | Common | 4,000,000 | 40.0% |
| Total | 10,000,000 | 100.0% |
After creating the option pool
Before raising a seed round, the founders create a 15% option pool for future employees. They authorize 1,764,706 new shares (calculated so that the pool equals 15% of the post-pool total).
| Shareholder | Share Class | Shares | Ownership |
|---|---|---|---|
| Founder A | Common | 6,000,000 | 51.0% |
| Founder B | Common | 4,000,000 | 34.0% |
| Option Pool | Reserved | 1,764,706 | 15.0% |
| Total | 11,764,706 | 100.0% |
The founders sold nothing. But their ownership percentage dropped as they created new shares. This is dilution. It happens every time new shares enter the cap table.
After a seed round
The company raised a $2M seed round at an $8M pre-money valuation ($10M post-money). Investors get 20% of the company. 2,941,176 new shares of Series Seed Preferred stock are issued by the company.
| Shareholder | Share Class | Shares | Ownership |
|---|---|---|---|
| Founder A | Common | 6,000,000 | 40.8% |
| Founder B | Common | 4,000,000 | 27.2% |
| Option Pool | Reserved | 1,764,706 | 12.0% |
| Seed Investors | Series Seed Preferred | 2,941,176 | 20.0% |
| Total | 14,705,882 | 100.0% |
The founders went from 60/40 to 40.8/27.2. The option pool went from 15% to 12%. Everyone diluted proportionally to make room for the new investors.
After a Series A
Two years later, the company raises a $5M Series A at a $20M pre-money valuation ($25M post-money). The lead investor negotiates a 10% option pool refresh (created pre-money, diluting existing shareholders). The company converts outstanding SAFEs from intervening rounds. Multiple share classes, each with distinct rights, are now present on the cap table.
| Shareholder | Share Class | Shares | Ownership |
|---|---|---|---|
| Founder A | Common | 6,000,000 | 24.0% |
| Founder B | Common | 4,000,000 | 16.0% |
| Option Pool (original + refresh) | Reserved | 2,500,000 | 10.0% |
| Seed Investors | Series Seed Preferred | 2,941,176 | 11.8% |
| SAFE Investors (converted) | Series Seed Preferred | 1,058,824 | 4.2% |
| Series A Investors | Series A Preferred | 5,000,000 | 20.0% |
| Employees (granted options) | Common (vesting) | 3,500,000 | 14.0% |
| Total | 25,000,000 | 100.0% |
Notice what happened. The founders started at 100% and now hold 40% combined. They didn’t sell any shares between the seed and Series A. Dilution from the option pool refresh, the SAFE conversions, and the new round reduced their ownership steadily. This is normal, and it is exactly why modeling dilution before each round matters.
At this stage, managing the cap table in a spreadsheet is no longer workable. There are multiple share classes with different liquidation preferences, employees vesting on different schedules, and converted instruments with different original terms. This is when most companies move to Carta or Pulley.
Growth stage and beyond
As the company continues to raise, each round adds another layer of preferred stock with its own terms. A Series B might bring participating preferred shares with a 1x liquidation preference and anti-dilution protection. A Series C might include a new board seat and pro rata rights that affect everyone below them in the stack.
Other events that change the cap table during growth:
Employee departures. When an employee leaves, they forfeit unvested options, which then return to the pool. Vested options typically have a 90-day exercise window. If they don’t exercise, those shares also return to the pool.
Secondary sales. A founder or early employee sells some of their vested shares to a third party, often during a later round. The total share count doesn’t change, but ownership transfers. These transactions need board approval and right-of-first-refusal waivers.
409A updates. Each funding round triggers a new valuation of common stock, which resets the strike price for future option grants. Early employees who got options at a $0.10 strike price are in a fundamentally different position than employees hired after the Series A at a $2.00 strike price.
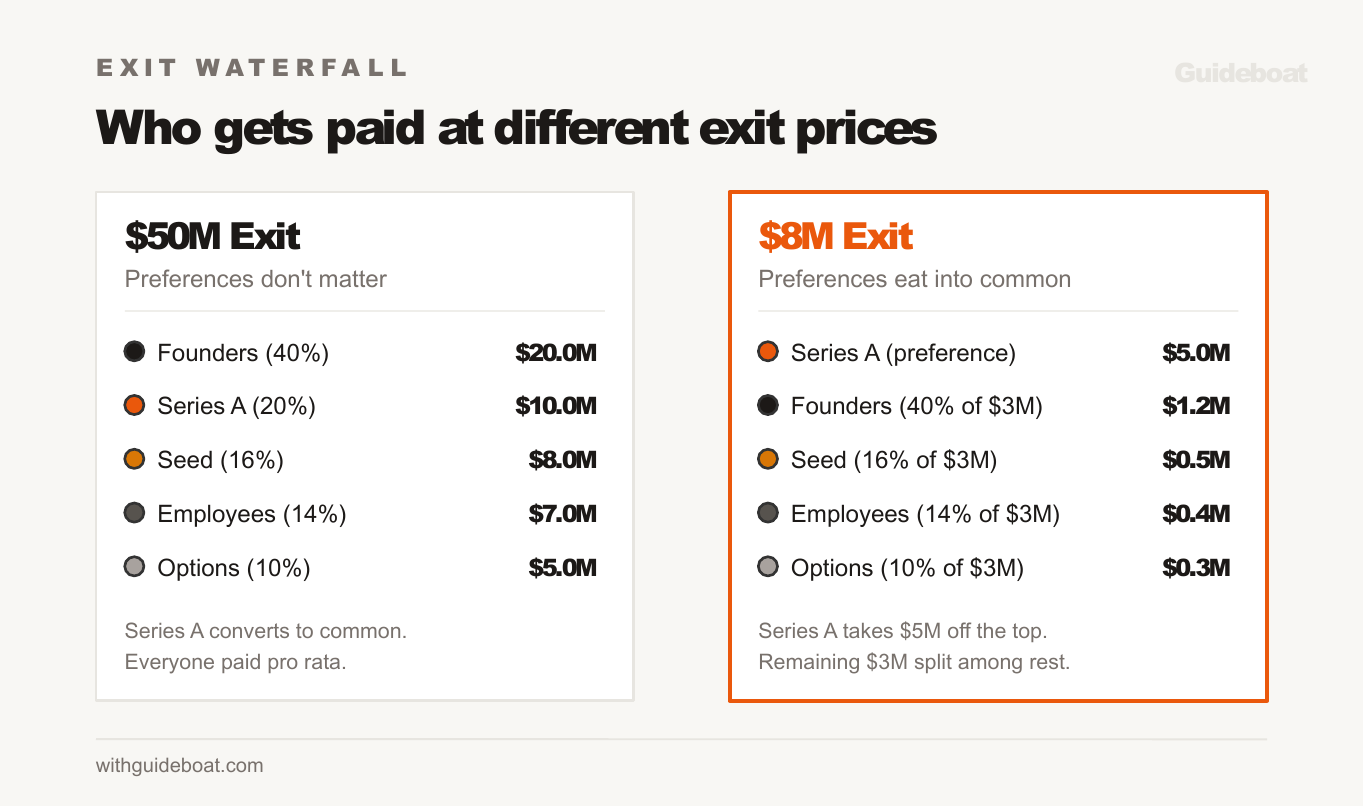
At exit
The cap table determines who gets paid and how much when the company sells or goes public. This is where liquidation preferences matter most. In a basic scenario:
If the company sells for $50M and Series A investors have a 1x non-participating preference on their $5M investment, they choose between getting their $5M back or converting to common and taking their 20% ($10M). They convert because 20% is worth more. Everyone gets paid pro rata.
If the company sells for $8M, the math changes. Series A investors take their $5M preference first. Everyone else will split the remaining $3 million. The founders, who own 40% of common, split $1.2M instead of the $3.2M they’d expect from a straight pro rata calculation.
Therefore, understanding the cap table is not an academic exercise. It determines the actual dollars that flow to each stakeholder at the moment it matters most. Founders who don’t model the waterfall (who gets paid what at different exit prices) before signing a term sheet are negotiating blind.
How to Read a Cap Table
Look at these values when reviewing a cap table:
Fully diluted shares outstanding refers to the total share count including all issued shares, all options (granted and ungranted), and all convertible securities. This denominator determines everyone’s real ownership percentage and is the number sophisticated investors use when evaluating equity positions.
Ownership on a fully diluted basis. Not the basic “shares held divided by shares issued” number. The fully diluted number includes everything that could become shares: options, warrants, SAFEs, convertible notes. This is the number investors care about.
Option pool size and usage. How big is the pool? How much has the company granted versus how many options remain ungranted? A 15% pool with 12% already granted means you have 3% left for future hires before you need to expand it (which dilutes everyone again).
Share price by class. Different share classes carry different prices and different rights. Common stock (founders, employees) is typically priced lower than preferred stock (investors) because preferred shares include liquidation preferences, anti-dilution protection, and board representation. The ratio between preferred and common price is called the valuation discount, and it typically ranges from 3:1 to 5:1 at the seed stage.
When Things Get Complicated
Here’s what adds complexity:
SAFEs and convertible notes. These don’t appear as shares on the cap table until they convert into equity at the next priced round. But they represent future dilution. A company with $500K in outstanding SAFEs needs to account for those shares when modeling the next round. The cap table should show these as a separate section with the conversion terms.
Multiple rounds with different terms. Series Seed at $8M, Series A at $30M, each with different liquidation preferences, anti-dilution provisions, and participation rights. The cap table needs to reflect not only who owns what, but what rights each share class carries.
Secondary sales. When a founder or early employee sells shares to a third party, the cap table needs to track the transfer. The total share count doesn’t change, but the ownership does.
409A valuations. If you’re issuing stock options to employees, the IRS requires an independent fair market value assessment of your common stock to set the strike price. A 409A valuation typically costs $5-10K from a third-party provider (Carta and Pulley both offer this as part of their platform). Companies usually update it annually or after any material event, like a funding round or a major customer contract. Issuing options below the 409A price creates a tax liability for the recipient, so get the valuation done before granting options, not after.
Do You Need Cap Table Software?
It depends on complexity, not on company size.
A spreadsheet is fine if you have 2-3 shareholders, one share class, no options, and no convertible instruments. A two-founder LLC with no outside investors can track ownership in a Google Sheet. There is no reason to pay for software when the math is two rows of arithmetic.
You need software the moment any of these happen: you issue stock options to employees; you take on more than one class of equity, you have convertible instruments (SAFEs or notes) that will eventually convert; or you have over 5-10 stakeholders. At that point, the interactions between share classes, vesting schedules, conversion mechanics, and dilution modeling become too complex to manage reliably in a spreadsheet. One formula error compounds silently until it surfaces during diligence.
If you’re not a venture-backed startup but you have multiple shareholders, employee equity, or outside investors, you still need to track this carefully. A manufacturing company with three partners and a profit-sharing arrangement has a cap table, whether or not they call it that. The core issue is whether the ownership structure is clearly documented, ensuring everyone agrees on their holdings, and whether the records will withstand scrutiny when an owner wishes to sell their share or introduce a new partner.
My recommendation: start with a spreadsheet, move to software before your first priced round or your first employee option grant, whichever comes first.
Pulley. Cap table management for early-stage startups. Clean interface, scenario modeling, less expensive than Carta. Good for pre-seed through Series A.
Carta. The standard for venture-backed companies. Cap table management, 409A valuations, equity plan administration. More expensive but comprehensive. Most institutional investors expect you to be on Carta by Series A.
Cake Equity. A lighter-weight alternative that works well for international companies and smaller rounds.
Common Cap Table Mistakes
Not maintaining it in real time. Every option grant, every SAFE, every share transfer needs to be recorded when it happens. Reconstructing a cap table from memory six months before a fundraise is painful and error-prone.
Forgetting to model future dilution. Your cap table shows ownership today. Your investors care about ownership after the next round. If you have $1M in unconverted SAFEs and you’re about to raise a Series A, the post-close cap table will look different than most founders expect.
Option pool is too small. Carta’s 2025 data on 4,736 option pools shows the median pool size grows from 12% at Seed to 15.5% at Series A to 20.2% by Series E. Starting at 15% at Seed (as some standard advice suggests) puts you at the 75th percentile and likely gives away too much equity too early. If your current pool is nearly exhausted at Series A, the expansion comes out of the founders’ stake. Plan ahead.
Too many small investors. A cap table with 40 individual angel investors creates an administrative burden and can slow down future rounds (you need consent from each shareholder for certain actions). Consider using an SPV (special purpose vehicle) to consolidate small checks into one line item.
Not understanding fully diluted vs. basic. A founder who owns 60% of issued shares but 42% on a fully diluted basis has a different economic position than they think. Always think in fully diluted terms.
Undocumented verbal agreements. “I told my co-founder they’d get 10%.” “I promised my first employee equity.” “My advisor and I agreed on 1%.” None of these are real until they’re in writing. A verbal promise of equity is not a grant. It’s not on the cap table. And it’s a liability that will surface during due diligence when a lawyer asks “are there any outstanding equity commitments?” If you’ve made verbal promises, formalize them now. If the person no longer deserves the equity you promised, have that conversation before an investor’s lawyer forces it.
Missing IP assignments. If a co-founder, contractor, or early employee built core technology for your company and there’s no signed IP assignment agreement, the company may not legally own its own product. Every person who has contributed to building your product needs a signed agreement assigning their intellectual property to the company. This includes co-founders, contractors (especially freelance developers and designers), early employees who worked before formal agreements were in place, and advisors who contributed to product development.
Cleaning Up Before a Raise
If your cap table has accumulated issues, here is the process for fixing them before you start fundraising:
Step 1: Get a cap table tool. Stop managing your cap table in a spreadsheet if you’ve outgrown it. Import your data into Carta, Pulley, or Cake Equity and get an accurate view of your current state, including SAFE/note conversion modeling.
Step 2: Audit every equity holder. Go through every person on your cap table and verify: is there a signed agreement? Is the vesting schedule documented and correct? Are there any outstanding promises that aren’t on the cap table? Is the IP assignment in place?
Step 3: Fix the issues. For each problem, the fix usually requires a lawyer but is straightforward: draft and sign undocumented agreements, execute missing IP assignments, renegotiate oversized advisor grants or add vesting, get board approval for any informal option grants.
Step 4: Model the future. Before your first investor meeting, model what the cap table looks like after the round closes. Include SAFE/note conversions, new investor shares, a new option pool (investors will typically want 10-15% post-money), and founder dilution. You should know, before you start talking to investors, approximately what percentage you’ll own after the round closes.
During due diligence, an investor’s lawyer will review your articles of incorporation, all stock purchase agreements and option grants, all SAFE and convertible note agreements, the option plan and board approvals, IP assignment agreements, cap table accuracy against the documents, the 409A valuation, and any outstanding equity commitments. If any of these are missing or inconsistent, the deal doesn’t die immediately. But it slows down. And in a fundraising process where momentum is everything, a two-week delay to fix cap table issues can cost you the round.
The Bottom Line
Your cap table is the financial constitution of your company. It reflects not just who owns what today, but the incentive structure for the work that remains to be done. Get it right from the start, keep it current, and understand what it says before every major decision.
If your cap table has gotten complicated and you need help cleaning it up before a raise, a fractional CFO can audit the current state and model your next round.
Related guides: How to Raise Money for a Startup walks through the full fundraising process. SAFE vs. Convertible Note vs. Priced Round explains how different instruments affect your cap table. What Goes in a Startup Data Room covers how to organize your documents for diligence.