Unit Economics for Non-SaaS Businesses
Unit economics for CPG, manufacturing, services, and restaurants. How to calculate margins, CAC, and contribution by business type.
The Short Version
Every fundraising guide in the world tells you to know your unit economics. Then they explain LTV, CAC, and churn using a SaaS subscription business as an example. If you’re building a CPG brand, a manufacturing company, a services firm, or a hardware startup, that framework doesn’t directly apply. But the underlying principle does: investors want to see that every unit of your business generates more value than it costs to produce and sell.
This guide translates unit economics into the language of non-software businesses.
Why Unit Economics Matter (Regardless of Industry)
Unit economics answer the most fundamental question about your business: does the math work at the individual transaction level?
If it costs you $50 to gain a customer, and that customer generates $200 in gross profit over their lifetime, the math works. If it costs you $50 to gain a customer, and they generate $30, it doesn’t matter how fast you’re growing. You’re losing money on every transaction, and you can’t scale your way to profitability.
Elizabeth Yin of Hustle Fund, who has reviewed over 40,000 pitches, has said that the most common mistake she sees is founders who can’t explain their unit economics. It’s not that the numbers are bad. It’s that the founder hasn’t thought about them rigorously enough to explain them.
For non-SaaS businesses, the framework is the same, but the variables are different.
The SaaS Framework (and Where It Breaks)
In SaaS, unit economics are straightforward:
- CAC (Customer Acquisition Cost): What you spend to get a customer
- LTV (Lifetime Value): How much that customer pays you over their lifetime (ARPU (average revenue per user) x average customer lifespan)
- LTV:CAC Ratio: The magic number. 3:1 or better is the benchmark.
- Payback period: How many months until you recoup the acquisition cost
This framework works because SaaS revenue is recurring and predictable. A customer signs up, pays monthly, and either stays or churns. The variables are clean.
For non-SaaS businesses, the variables get messier. Revenue might be transactional, not recurring. Margins vary by product, by channel, and by season. Customer lifetime is harder to define. The cost structure includes physical goods, manufacturing, distribution, and retail placement that SaaS companies don’t deal with.
But the question is the same: does each unit of your business make money?
Unit Economics by Business Type
CPG and food and beverage
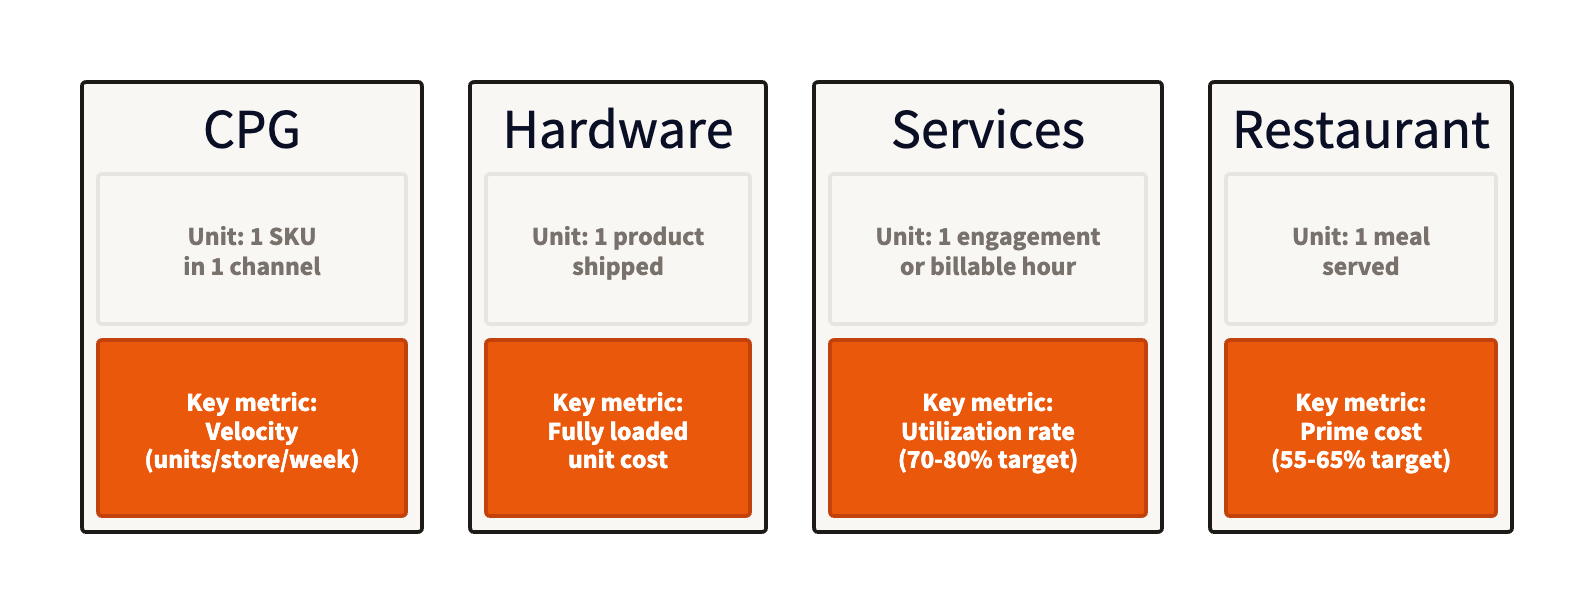
For consumer packaged goods, the unit is typically a single SKU (one product variant) sold through a specific channel.
The key metrics:
Gross margin per unit. What you sell it for minus what it costs to make (COGS, or cost of goods sold: ingredients, co-packing, packaging, labeling). Abby Richards, a fractional CFO who works only with CPG brands, emphasizes that most emerging brands undercount their true COGS. They forget to include inbound freight, quality testing, shrinkage, and co-packer minimums. If you’re showing 60% gross margins, but you haven’t accounted for these, your real margin is 40-45%.
Trade spend. The cost of getting on the shelf and staying there. Slotting fees, promotional discounts, demos, and distributor margins. For retail CPG, trade spend can eat 20-40% of your revenue. This is the number that kills brands that look profitable on paper but aren’t. Investors who understand CPG will ask about this. If you don’t have a clear answer, it’s a red flag.
Velocity. Units sold per store per week. This is the metric retailers and CPG investors care about most. High velocity means customers are pulling your product off the shelf. Low velocity means you’re taking up space that could go to a competitor. Graphite Financial has written about why velocity is the leading indicator for CPG fundraising.
Customer acquisition cost (by channel). In DTC (direct to consumer), this is your digital ad spend divided by customers acquired. In retail, it’s more complex: the combination of trade spend, broker fees, and marketing required to get placement and maintain it. Track CAC by channel because the economics are different. A DTC customer acquired for $15 through Instagram is a different unit than a retail placement that costs $50K in slotting fees but reaches 500 stores.
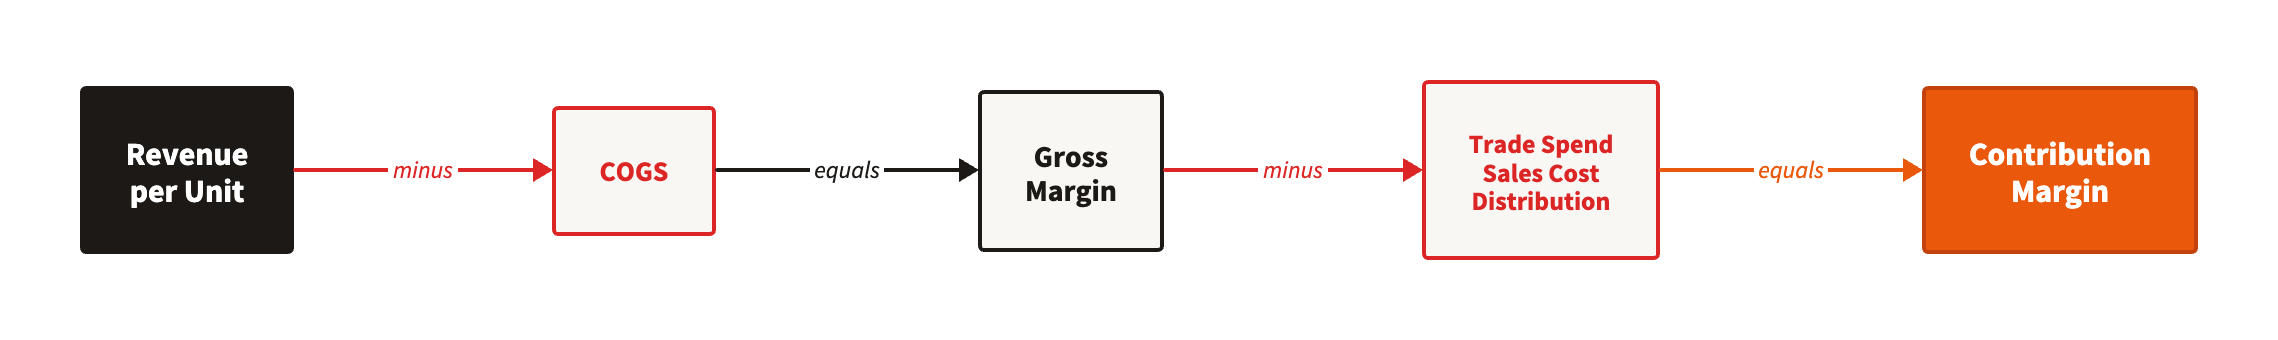
Contribution margin. Revenue minus COGS minus trade spend minus channel-specific costs. This is the real number. If your contribution margin is positive, scaling makes sense. If it’s negative, growing faster means losing money faster.
Manufacturing and hardware
For hardware and manufacturing companies, the unit is the physical product you ship.
What to track:
Bill of materials (BOM) cost. The raw material and component cost for one unit. This is your foundation. Hardware founders often quote the BOM at scale pricing before they’ve reached scale. Be honest about your current BOM and show the path to cost reduction as volume increases.
Fully loaded unit cost. BOM plus labor, assembly, quality control, packaging, and shipping. This is the number that matters, not the BOM alone.
Gross margin at current volume vs. at scale. Hardware margins are volume-dependent. You might be at 25% margin making 100 units per month and 55% margin at 10,000 units per month. Show both numbers, and the assumptions that connect them.
Customer acquisition cost. For B2B hardware, this is a sales-driven process: sales team costs, trade shows, demos, and the sales cycle length. A 6-month sales cycle with a dedicated sales rep has a different CAC than a self-serve DTC model.
Installation and support costs. If your product requires installation, commissioning, or ongoing maintenance, these are unit-level costs that need to be included. A product that costs $5,000 to manufacture and sells for $15,000 looks like a great margin until you account for $3,000 in installation and $2,000/year in support.
Professional services and agencies
For services businesses, the unit is the engagement, or the billable hour.
The key metrics:
Effective hourly rate. Total revenue divided by total hours worked (not billed). If you bill $200/hour but only bill 60% of your hours, your effective rate is $120/hour. This is the number that determines whether your business model works.
Utilization rate. Billable hours divided by total available hours. Top services firms run at 70-80% utilization. Below 60% and you’re struggling to cover overhead. Above 85% and your team is burning out.
Gross margin per engagement. Revenue from the project minus the direct cost of delivering it (employee time, contractors, tools, travel). Target 50%+ for healthy services economics.
Client retention and expansion. The services equivalent of LTV. How long does an average client stay? What percentage of clients expand their engagement? A services firm with 80% annual retention and 30% expansion revenue has fundamentally different economics than one churning clients every 6 months.
CAC and sales cycle. How much does it cost to win a new client, and how long does it take? For referral-based businesses, CAC is low. For businesses that depend on outbound sales or RFPs, it can be significant.
Restaurants and hospitality
For restaurants, the unit economics are well-established but often poorly tracked.
The numbers that matter:
Food cost percentage. Cost of ingredients divided by menu price. The industry standard is 28-35%. Above 35% and your pricing or purchasing needs attention.
Labor cost percentage. Total labor (including benefits and payroll taxes) divided by revenue. Target 25-35% depending on service model. Fast casual runs lower. Full service runs higher.
Prime cost. Food cost plus labor cost. This is the number that determines whether a restaurant is viable. Target 55-65% of revenue. Above 65% and you’re not leaving enough margin for rent, utilities, and profit.
Revenue per available seat hour (RevPASH). Total revenue divided by (seats x hours open). This tells you how efficiently you’re using your space. It’s the restaurant equivalent of revenue per square foot in retail.
Average check size and table turn rate. How much each customer spends and how many times you can seat each table per service. These two numbers, combined with your seat count and hours of operation, determine your revenue ceiling.
How to Present Unit Economics to Investors
The format matters almost as much as the numbers. Here’s how to make it clear:
Lead with the unit. Define what “one unit” of your business is. A single SKU sold at retail. One device shipped. One engagement completed. One meal served. Be explicit so the investor is looking at the right thing.
Show current state and target state. Where are your unit economics today, and where will they be at scale? The gap between current and target is your operating leverage story. But be realistic. If your current gross margin is 30% and your target is 70%, you need a rational explanation of what changes to get there.
Break down the waterfall. Start with revenue per unit and subtract costs layer by layer until you get to contribution margin. Name each layer and quantify its cost. Investors want to see where the money goes.
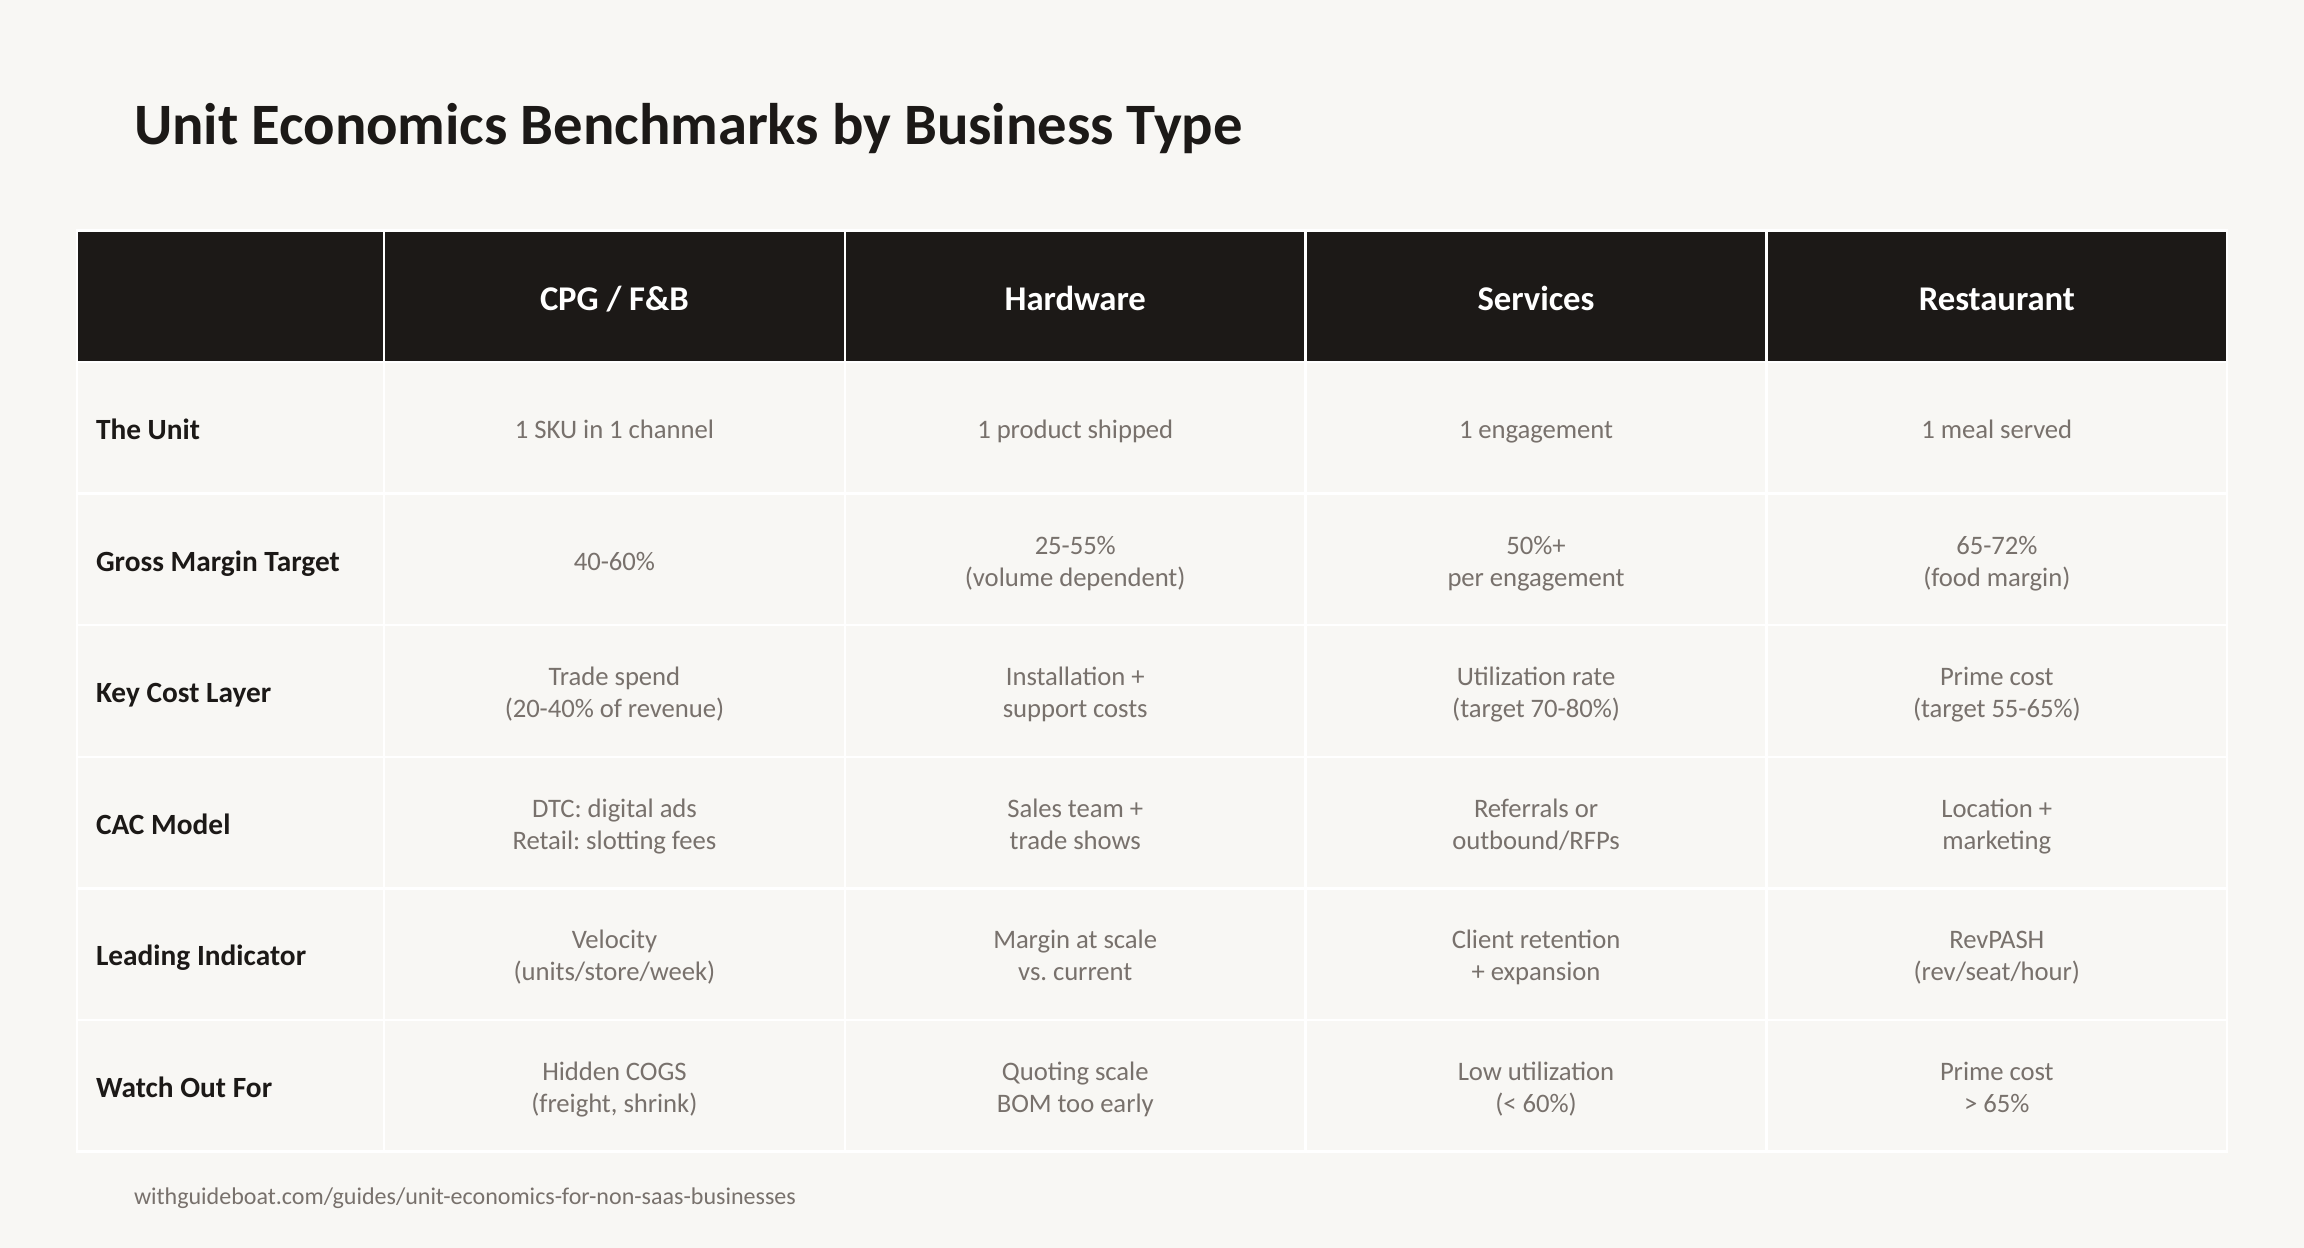
Compare to benchmarks. If your industry has established benchmarks (CPG margins, restaurant prime costs, services utilization rates), show how you compare. Meeting or exceeding the benchmark is a positive indicator. Being below benchmark is fine if you have a clear plan to close the gap. Being below benchmark with no explanation is a red flag.
Show the path to profitability. Unit economics should connect to your financial model. If your model projects profitability at $5M in annual revenue, your unit economics should make that math obvious. X units sold at Y contribution margin = Z operating income. If the numbers don’t connect, fix them before you pitch.
Common Mistakes
Using SaaS benchmarks for non-SaaS businesses. A 3:1 LTV:CAC ratio is a SaaS benchmark. It might not apply to yours. Know your industry’s benchmarks and use those.
Ignoring channel costs. Gross margin is not contribution margin. Trade spend, distribution, commissions, and channel-specific costs sit between the two. Many founders present gross margin as if it’s the bottom line. Investors who know your industry will see through this.
Quoting scale economics before you’re at scale. “When we’re making 100,000 units, our COGS drops to $X.” That’s a projection, not a fact. Present your current economics and show the assumptions that get you to scale. Investors prefer honest mediocre numbers with a credible improvement plan over fantasy numbers with no grounding.
Not tracking by channel. Your DTC channel and your retail channel are different businesses with different margins, different CACs, and different customer behaviors. Track and present them separately. A blended number hides the story.
Conflating revenue with cash. In CPG and manufacturing, you might recognize revenue on shipment but not receive payment for 60-90 days. Your unit economics might look great on an accrual basis (recording revenue when earned, not when cash arrives) while your cash flow is negative. Both matter. Show both.
The Bottom Line
Unit economics are how you prove that your business model works at the transaction level. The specific metrics vary by industry, but the underlying question is always the same: does each unit of your business generate more value than it costs?
If it does, show it. If it doesn’t yet, show why it will, and make the assumptions explicit. Investors can handle honest numbers. What they can’t handle is a founder who hasn’t thought about them.
If translating your business model into unit economics that investors understand isn’t your strength, a fractional CFO who works with non-SaaS businesses can help you build the framework and present it credibly.
For market sizing methodology, see TAM SAM SOM: How to Size Your Market. For the full capital landscape, see How to Find Investors for a Small Business.